Platform · 03 Research
Praxis
Applied Safety Intelligence
Every mining company files safety data with its regulator — in the US, MSHA. Most never look at it systematically. Praxis automates the entire process — internal benchmarking, peer comparison, and AI models grounded in published research, updated weekly — and turns what it finds into forms and field checks your crews actually use.

Other tools flag your violations. We show you how you rank against every mine in your district — and where the risk is building before MSHA sees it.

Where it sits in the loop
01 Collect · Forma 02 Integrate · Nexus 03 Research · Praxis 04 Model · TSAI 05 Engage · Performa
Three Capabilities
Internal. Peer. Academic.
All Three at Once.
🏭
Internal Benchmarking
Compare performance across your own sites. Which mines have the highest S&S violation rates? Which shifts have the best safety records? Which equipment categories drive the most MSHA citations? Your own data analyzed systematically — not just reported. Identify your best sites and understand what they're doing differently.
📡
Peer Benchmarking
How does your TRIR compare to Peabody? Your violation rate per million tons vs Arch Resources? Praxis pulls public filing data for every operator in your commodity and region and builds a normalized comparison. Production-adjusted metrics ensure you're comparing like for like — not just raw counts.
🔬
Research Operationalization
MSHA data is the most studied mine safety dataset in the world. Decades of peer-reviewed research have produced published models linking violations, inspections, and production to injury outcomes. Our LLMs read these publications, domain experts curate the findings, and we operationalize the models against your data. Your operation measured against published science — not just competitors.
Platform Workflow
1 — Industry Dashboard
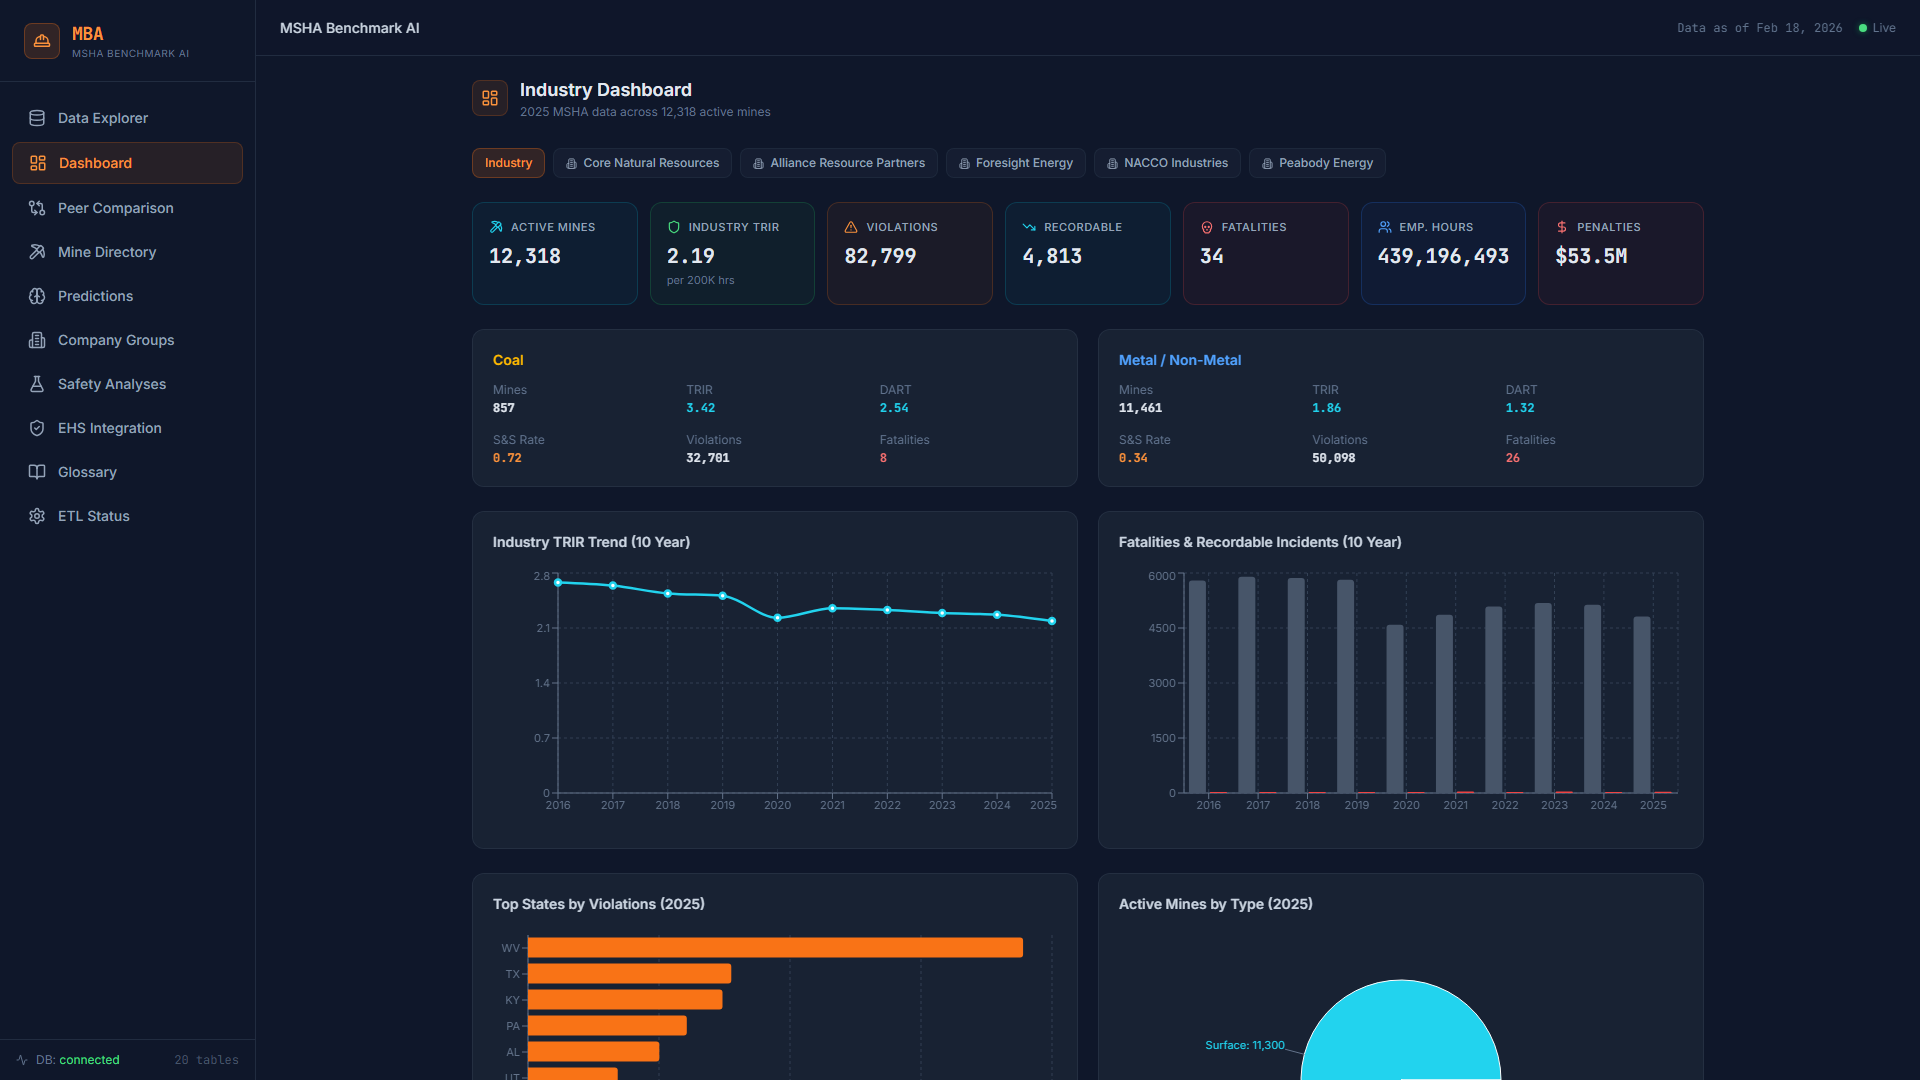
Industry Dashboard — Live MSHA Data
Live KPIs and trend charts from 20+ MSHA datasets, updated weekly.
2 — Internal Data Integration
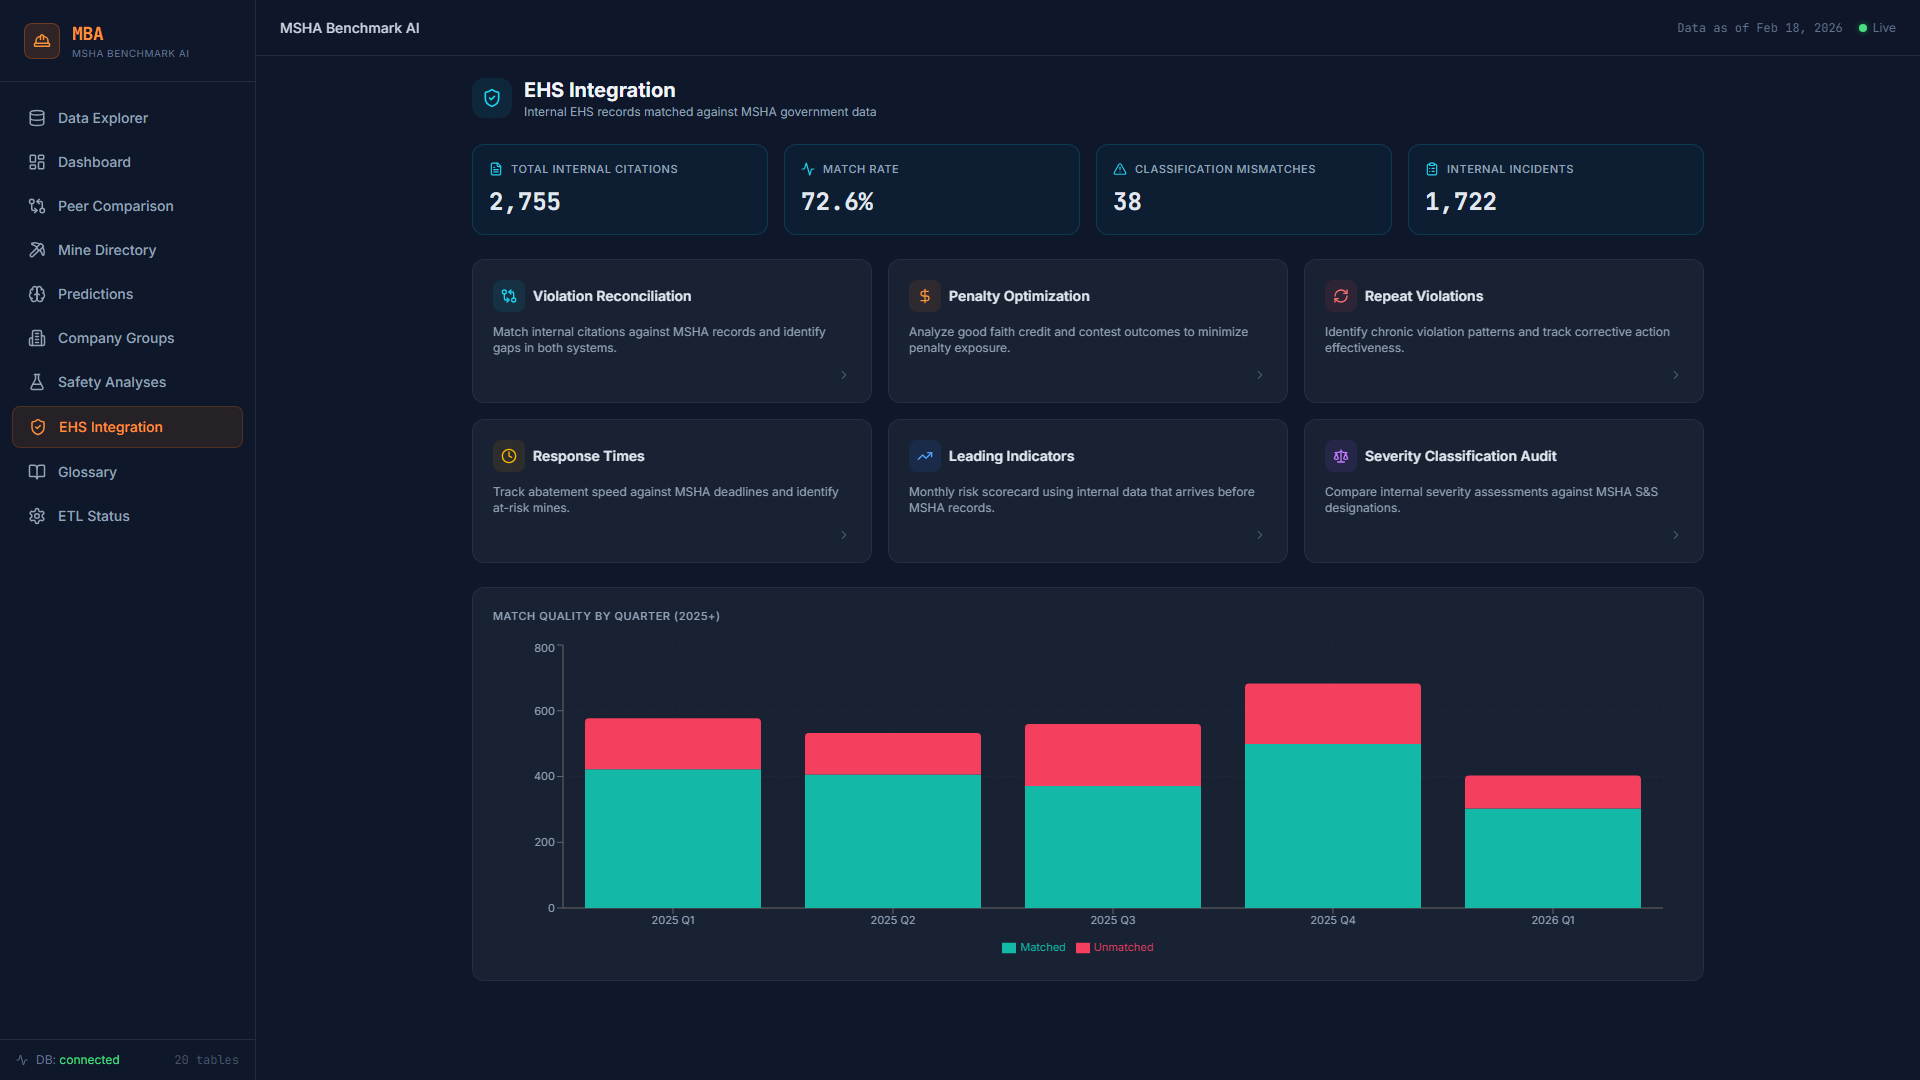
EHS Integration — Internal records matched against MSHA government data
Your internal EHS records merged with MSHA government data into one picture.
3 — Reconciliation
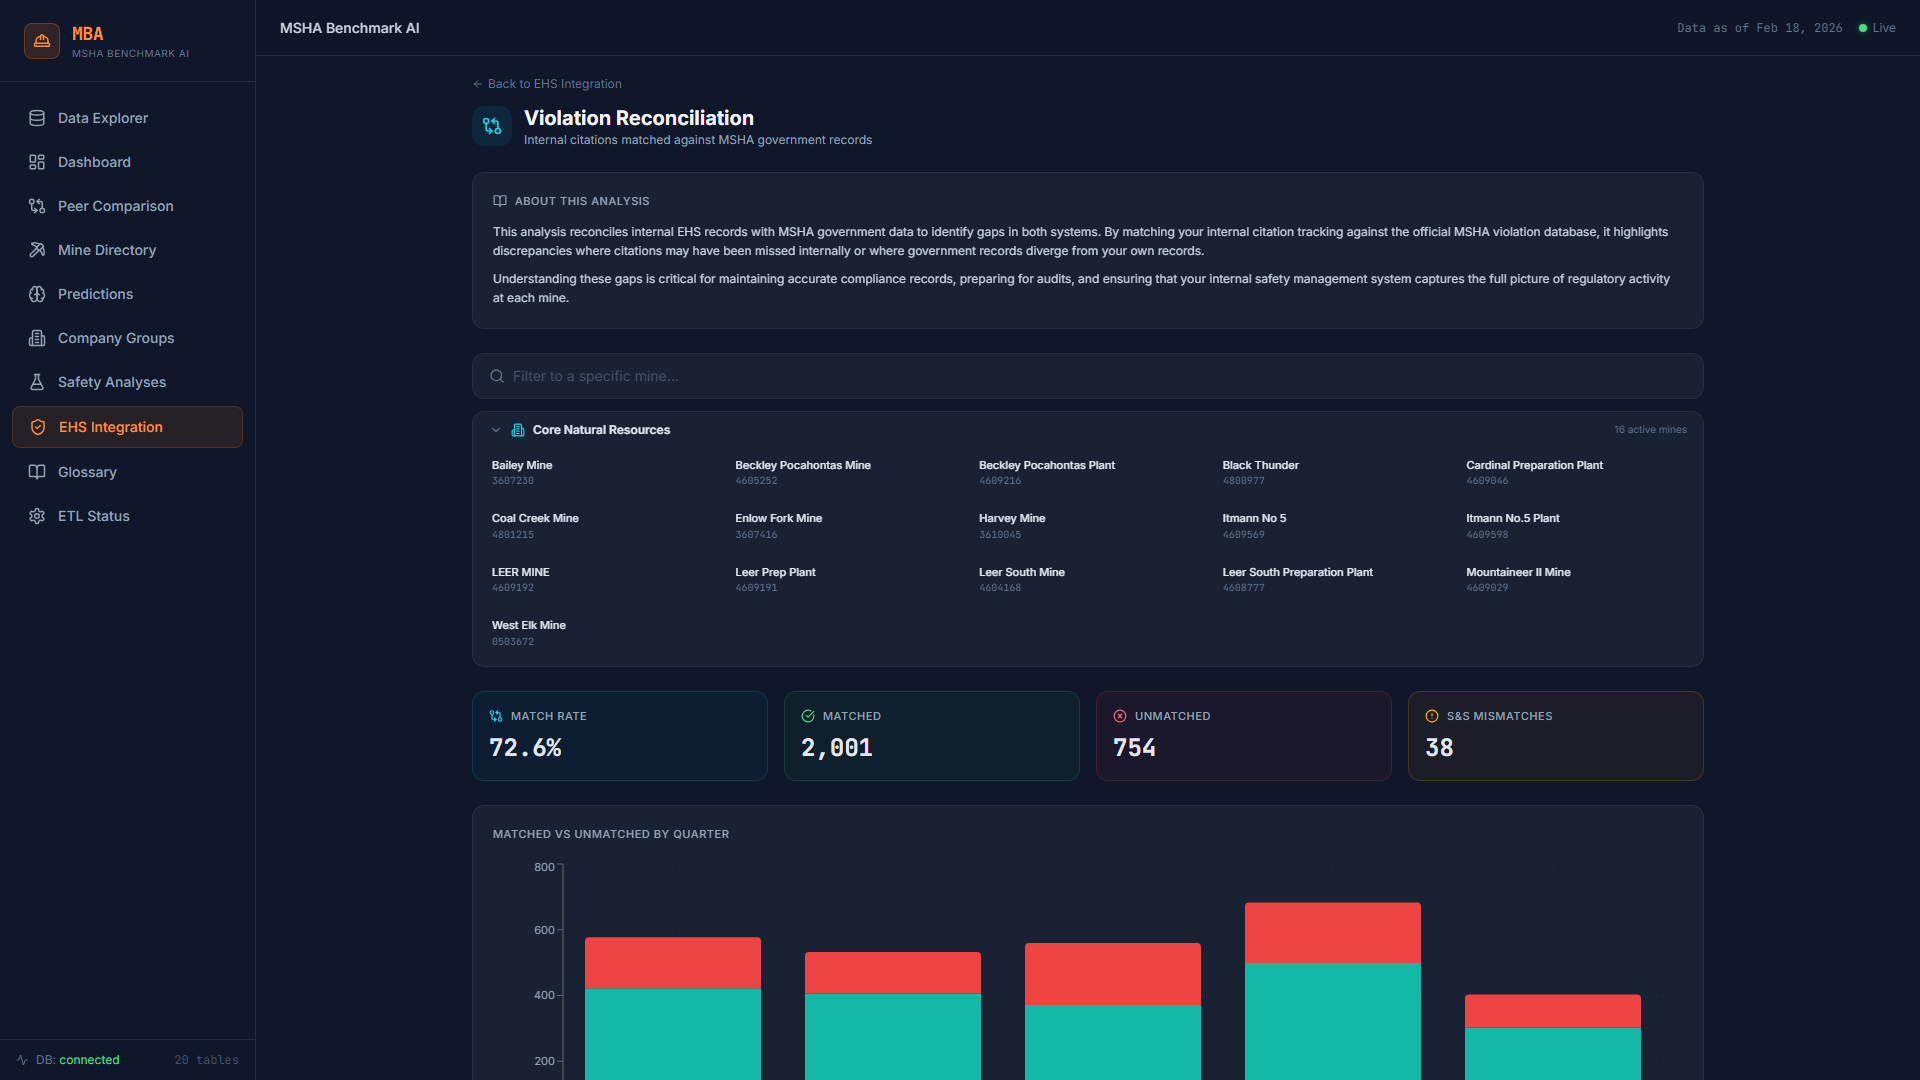
Violation Reconciliation — Internal citations matched against MSHA records
Match internal citations against MSHA records — identify gaps in both systems.
4 — Peer & Internal Benchmarking
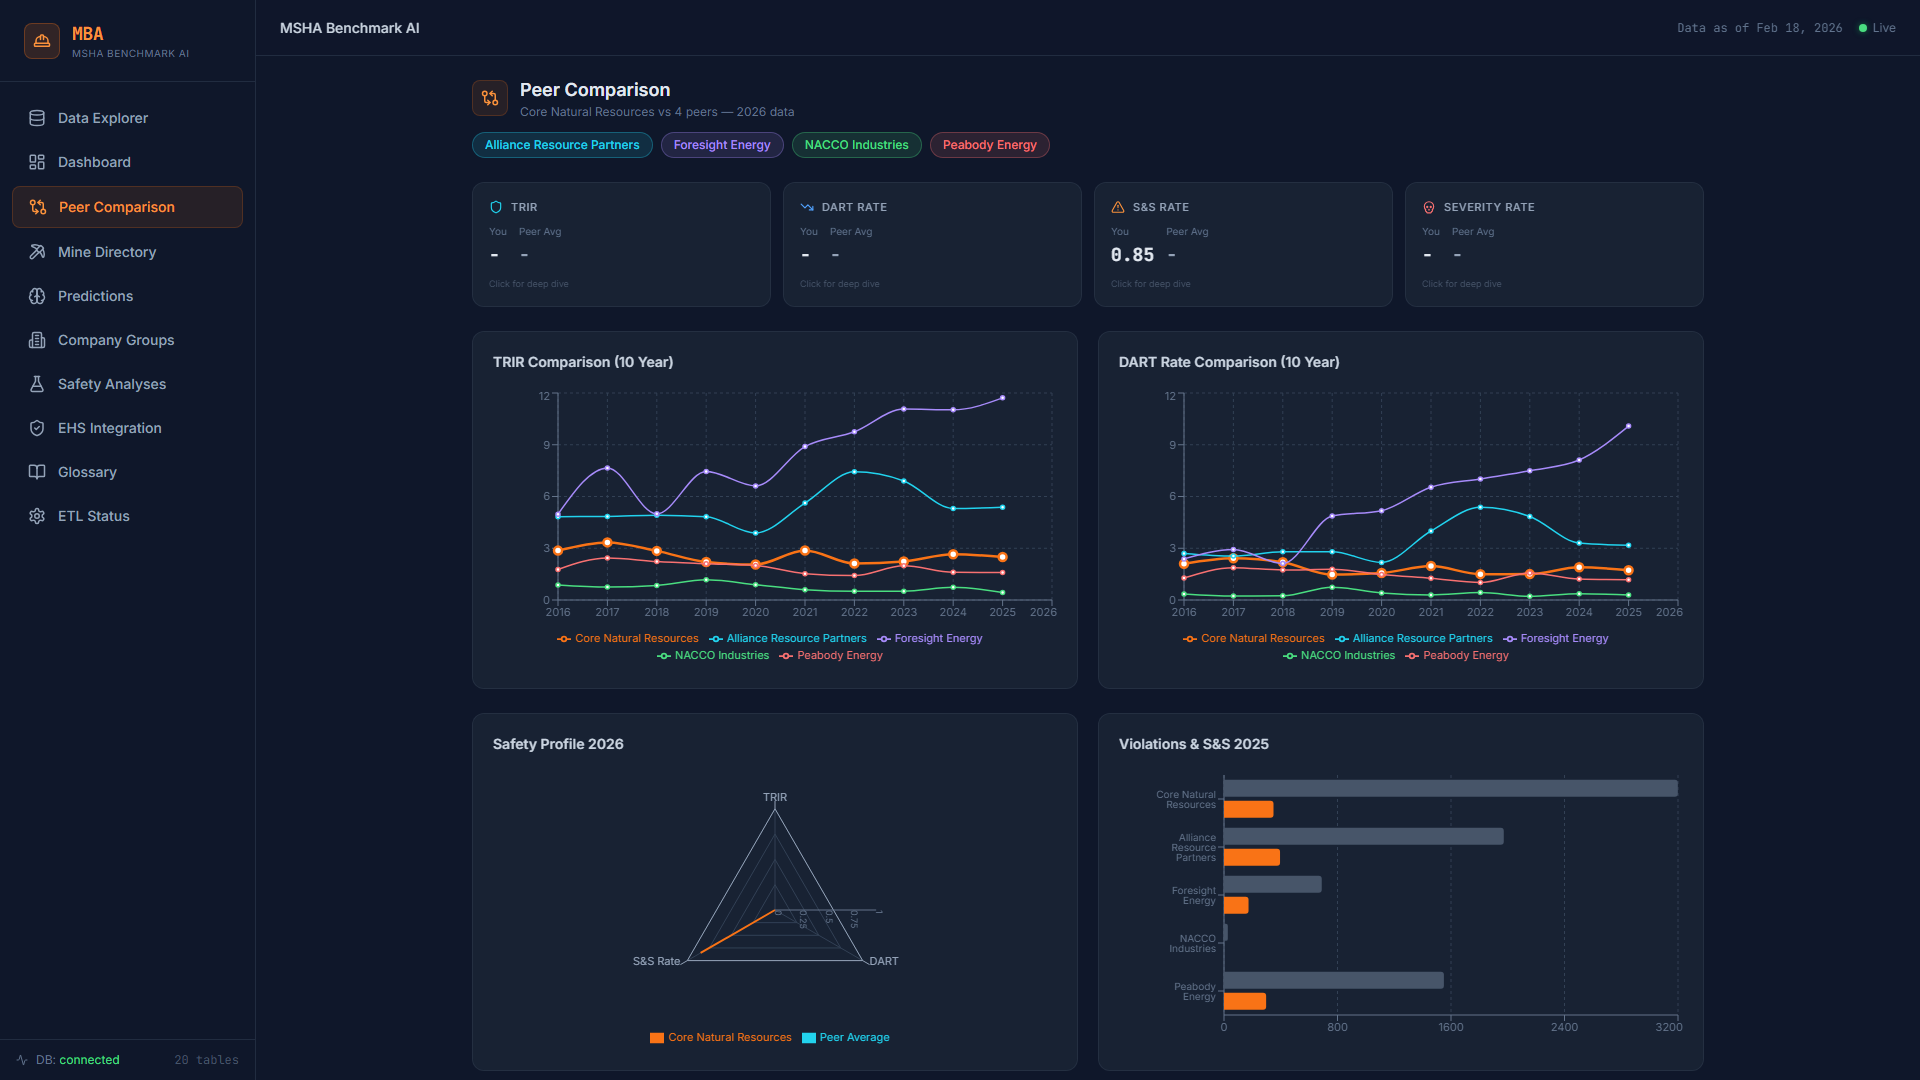
Peer Comparison — TRIR and DART rate trends across companies
Compare your sites internally and against every peer in the MSHA registry.
5 — Deeper Analytics
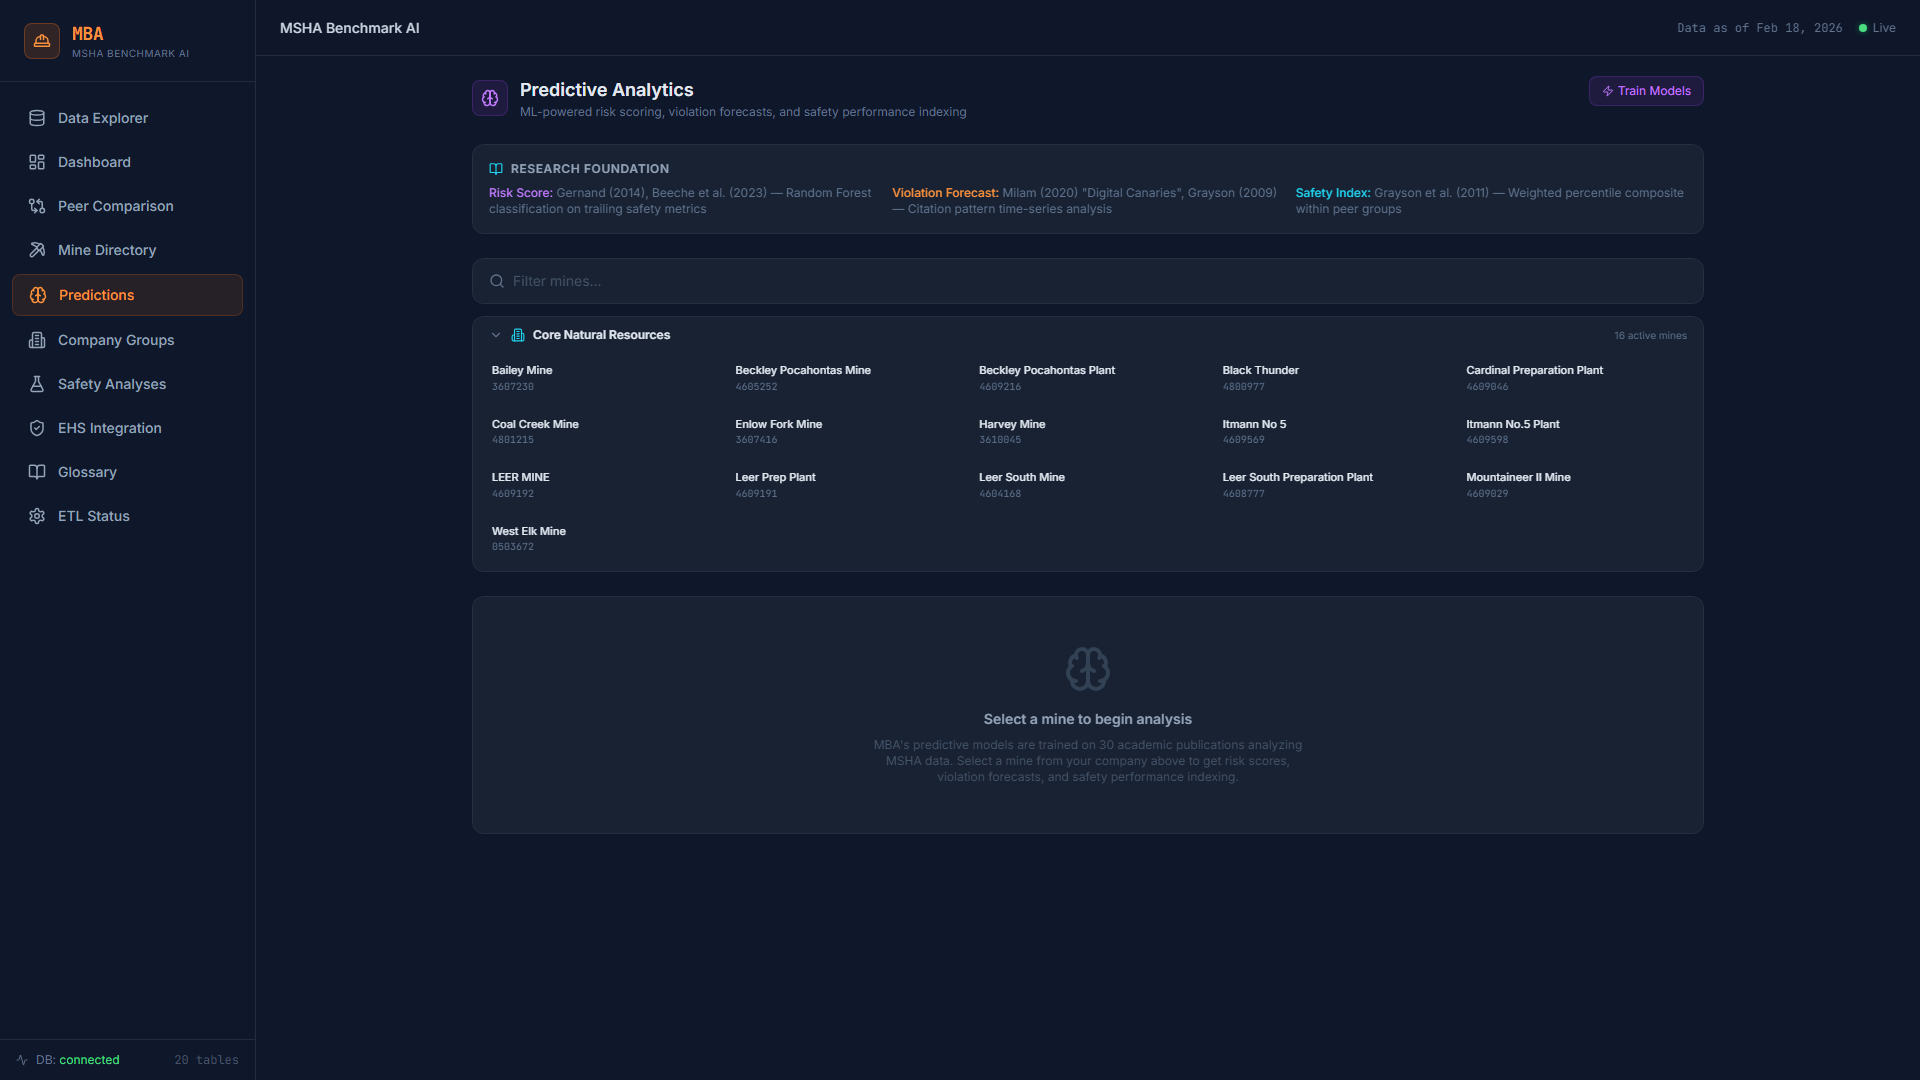
Predictive Analytics — ML-powered risk scoring and violation forecasts
Predictive models, research-backed tools, and AI anomaly detection.
How Research Runs
Point. Save. Schedule. Return.

Research is a standing capability, not a study. A safety question becomes a saved model, the model re-runs as new field data lands in the warehouse, and the result reaches crews through Performa — never a PDF on a shelf.

01
Point
Aim AI at the integrated data with a safety question — fatigue, repeat events, a control worth watching. The context library of your bow-ties, critical controls and site history grounds the answer.
02
Save
The analysis becomes a saved, versioned model — not a one-off report. Every assumption and source is kept with it.
03
Schedule
It re-runs automatically as forms, incidents and regulator refreshes arrive in the warehouse.
04
Return
Findings become a form or a 30-second critical-control check in Forma, and results land in crew rotations and scoreboards in Performa.
Standards it operationalizes
ICMM Critical Control ManagementNMA CORESafetyBow-tie risk managementBehavior-based safetyRegulator reporting
Data Foundation
20+ MSHA Datasets.
Integrated With Yours. Weekly.

Praxis doesn't just pull government data — it merges it with your internal EHS records to create a single, reconciled safety picture. All 20+ MSHA datasets are downloaded, cleaned, validated, and joined with your company's incident tracking, citation logs, and production systems into a unified dimensional model. Every week, automatically. Historical data back to the year 2000 available for trend analysis.

DatasetCoverage
Mine Violations (S&S and non-S&S)All US mines, 2000–present
Accident & Injury ReportsMSHA Part 50 filings
Inspection RecordsRegular and spot inspections
Annual Production DataTonnage by commodity and mine
Employment & HoursFor injury rate normalization
Penalty AssessmentsCitation severity and penalty amounts
Mine Status & OperatorsActive, idle, abandoned mines
Pattern of Violations (POV)MSHA POV program status

EHS Integration & Reconciliation

Your internal EHS records matched against official MSHA government data — identifying gaps in both systems, classification mismatches, and unmatched citations. Violation reconciliation ensures your internal tracking aligns with what MSHA has on file, while production records, shift data, and equipment logs are joined for normalized metrics and root cause analysis that goes beyond what either system can show alone.

AI Anomaly Detection

Automated detection of unusual spikes in violations, injury rates, or inspection intensity relative to your historical baseline and peer group. Flags emerging issues before they reach regulatory attention.

POV Early Warning

Predictive risk scoring that identifies mines trending toward Pattern of Violations status. The POV program results in elevated inspection frequency and significant operational constraints — early warning gives you time to act.

Natural Language Reports

AI-generated executive summaries of your benchmarking position, updated weekly. Board-ready safety intelligence without requiring an analyst to compile it.

Inspector Pattern Analysis

MSHA inspectors have IDs in the public data. Some cite certain standards far more aggressively than others. Know which inspector is assigned to your district and what they prioritize — tactical intelligence no other tool provides.

Pre-Inspection Checklist Generator

Based on your mine's violation history, benchmark weaknesses, and the most-cited standards in your district — a data-driven checklist of what to walk through before your next inspection. No cameras required.

Peer Pool
Know Where You Stand
Against Your Competitors

Default peer comparison pools include the major US coal operators. Custom peer groups can be built from any subset of the MSHA registry — by commodity, state, mine type, production volume, or any combination.

Peabody Energy Arch Resources Alpha Natural Resources Alliance Resource Partners Warrior Met Coal Foresight Energy CONSOL Energy Any operator in the MSHA registry
Key Metrics Tracked
TRIR Total Recordable Incident Rate
S&S Rate Significant & Substantial violation rate
Inspection Intensity Inspections per mine per year
Violations / MT Per million tons produced
Injuries / 200K hrs MSHA standard normalization
Penalty Severity Average penalty per citation
Most-Cited Standards CFR citation frequency analysis
POV Risk Score AI-predicted POV trajectory
Trend Direction 12-month rolling vs prior period
Safety Analysis
The Most Studied Safety Data
in the World. Operationalized.

MSHA data is the most heavily studied mine safety dataset on Earth. Decades of peer-reviewed research have produced published models linking violation patterns, inspection frequency, production variables, and workforce factors to injury rates, penalty exposure, and fatality risk.

Most of that research sits in journals no safety manager will ever read. We change that. Our LLMs ingest peer-reviewed publications, extract the statistical models and analytical frameworks, and — with human curation from domain experts — operationalize them into tools that run against your data. Every analysis in the Safety Analysis Suite is grounded in published science, not proprietary guesswork.

Research-to-Operations Pipeline

Peer-reviewed papers are read by LLMs that extract methodology, statistical models, and key findings. Domain experts curate and validate the extraction. The models are then implemented as live analytical tools that run against MSHA public data combined with your internal records — turning academic research into actionable safety intelligence.

Published Sources Include

Each analysis cites its source research directly in the application:

NIOSH Safety Pays (2019) Yilmaz (2011) Gernand (2014) Grayson (2009) Milam (2020) Li (2022) Beeche (2023) Amoako (2021) Yedla (2020) Groves (2007)
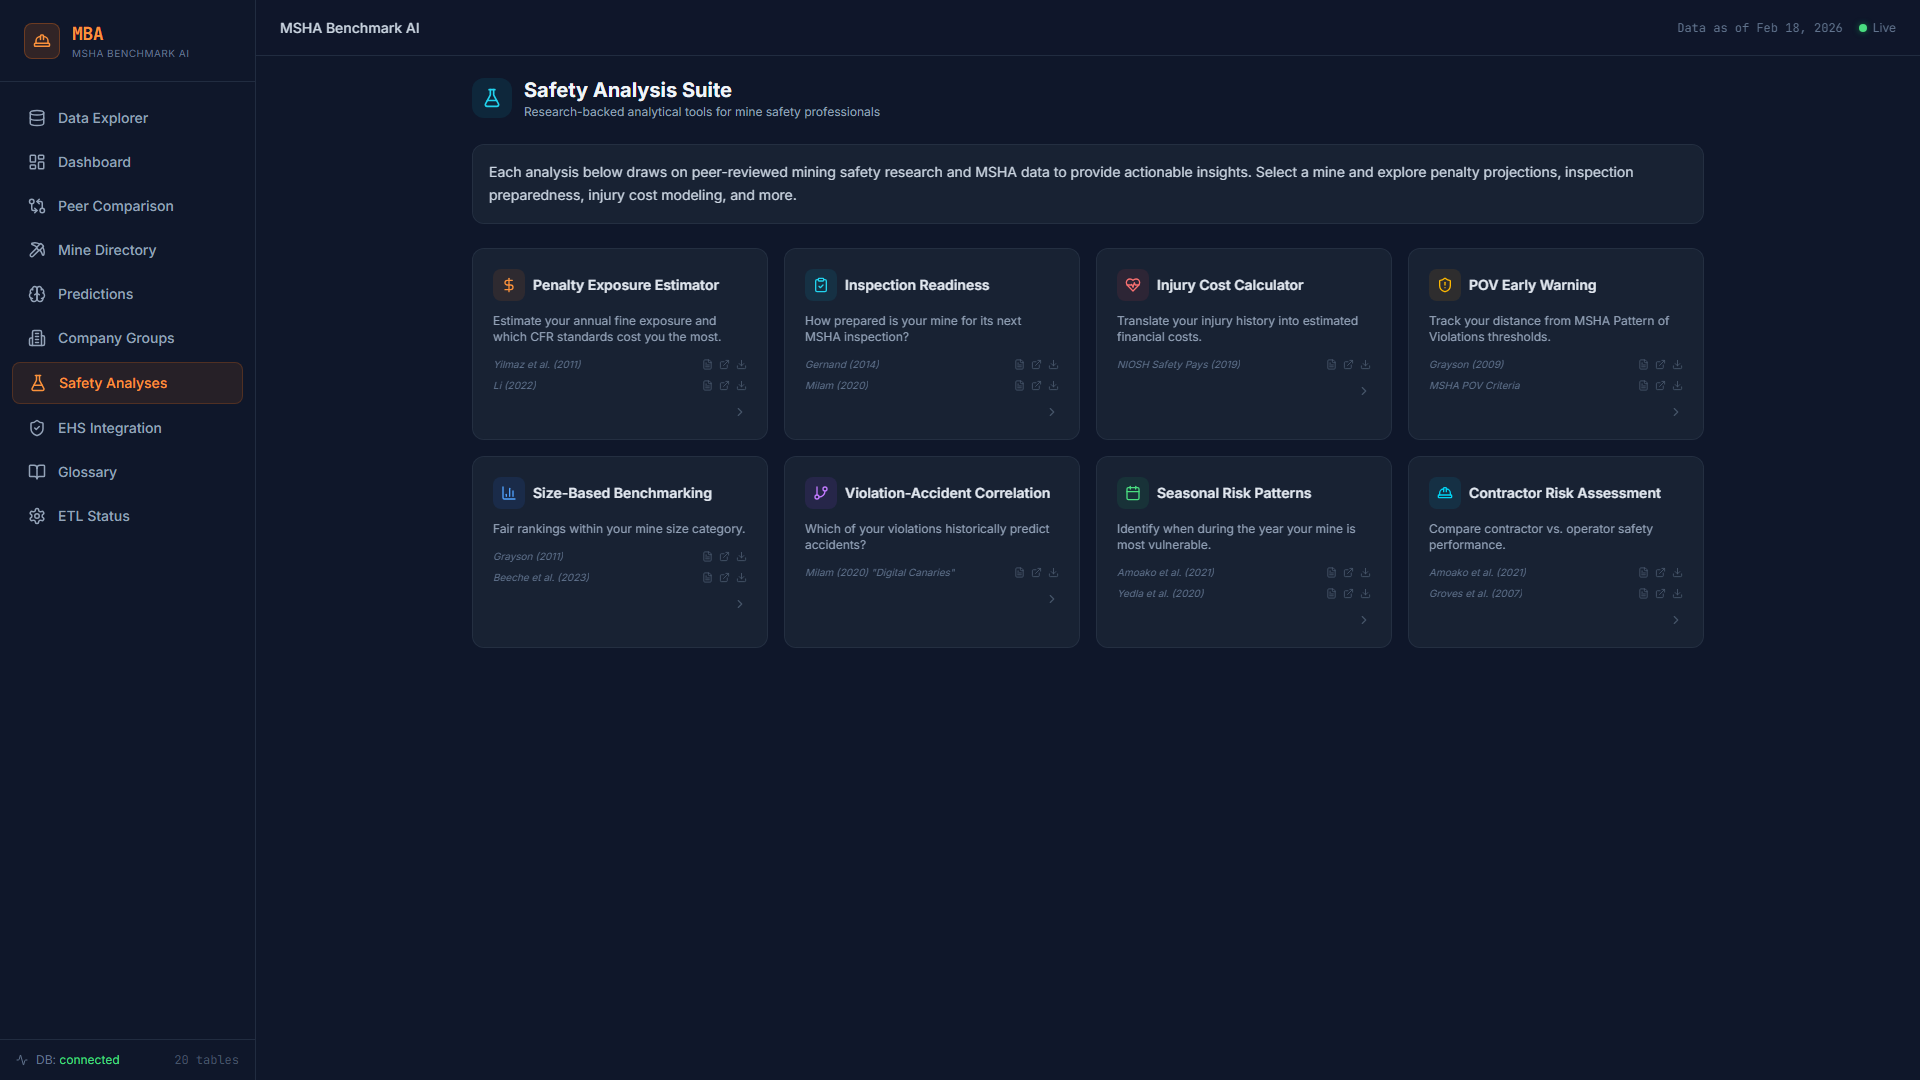
Safety Analysis Suite — 8 Research-Backed Tools
Safety Analysis Suite — Research-backed analytical tools for mine safety professionals
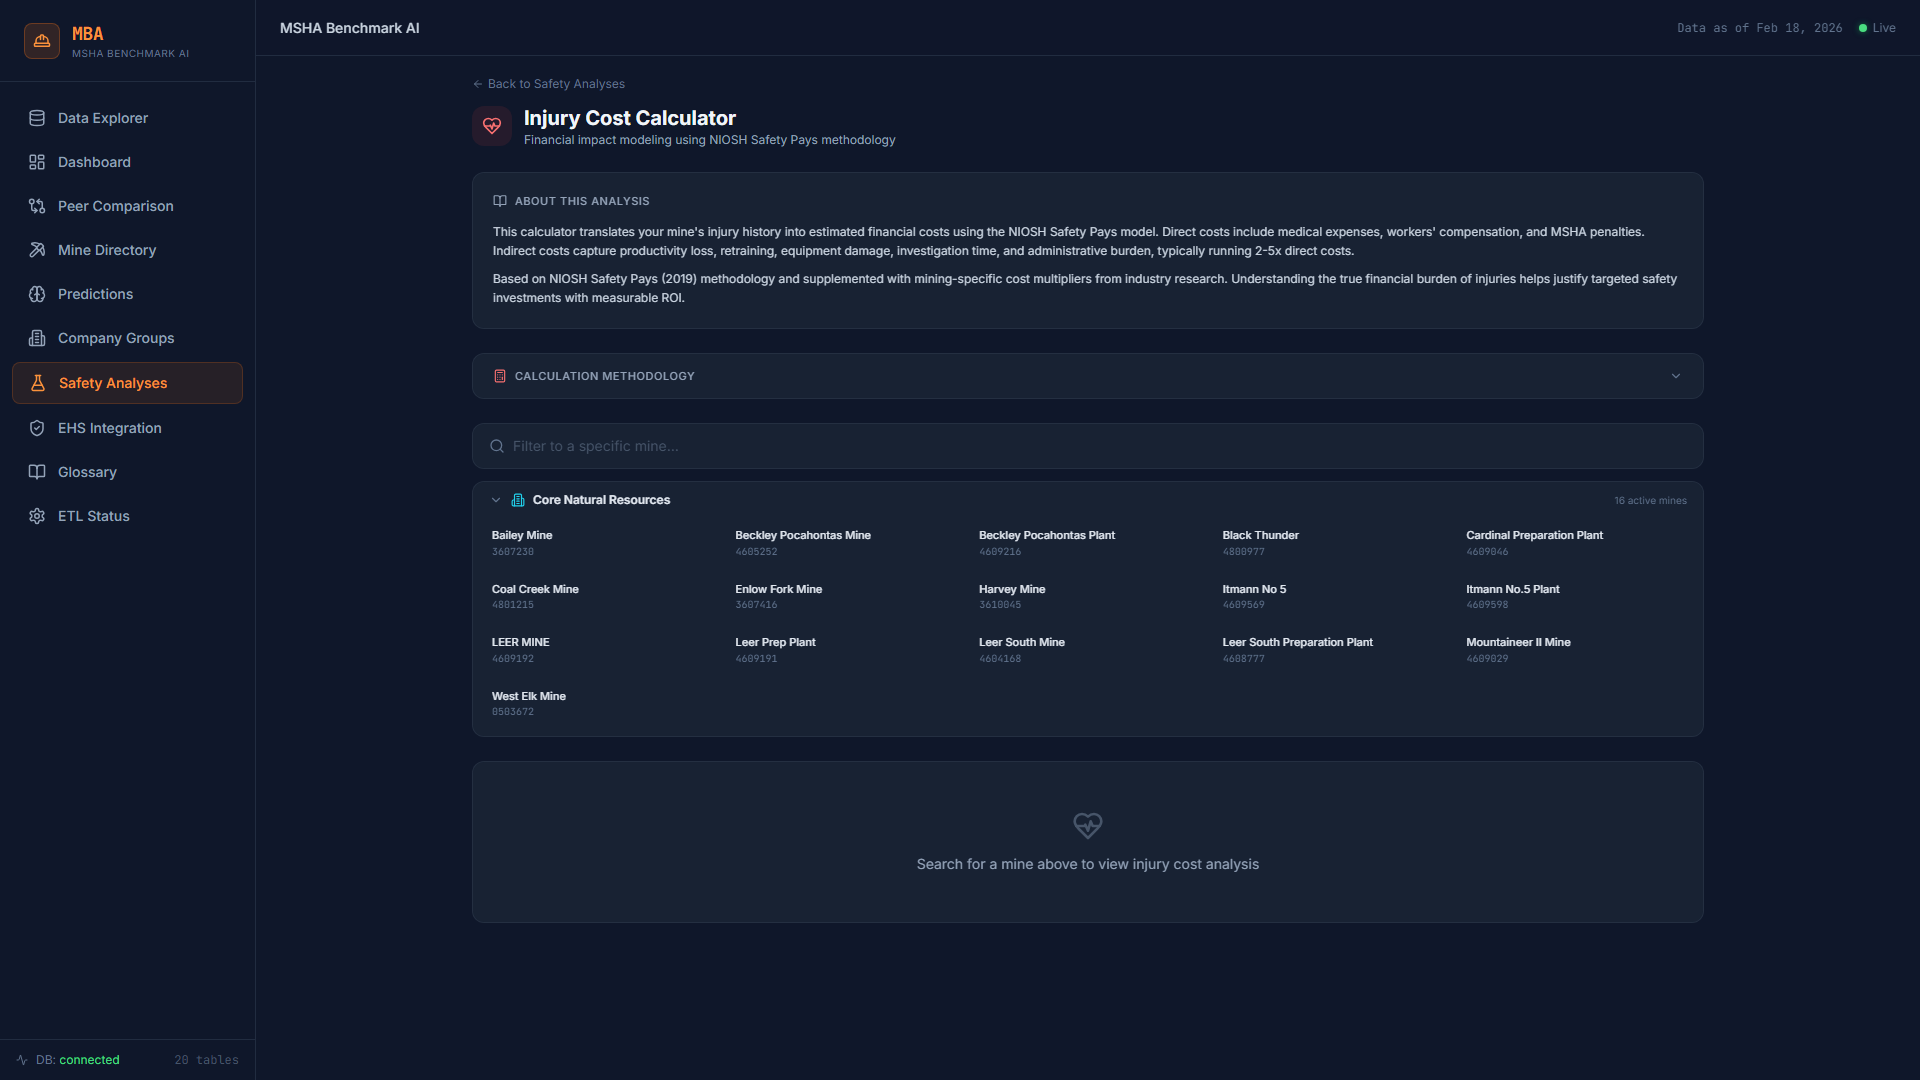
Injury Cost Calculator — Based on NIOSH Safety Pays
Injury Cost Calculator — Financial impact modeling using NIOSH Safety Pays methodology
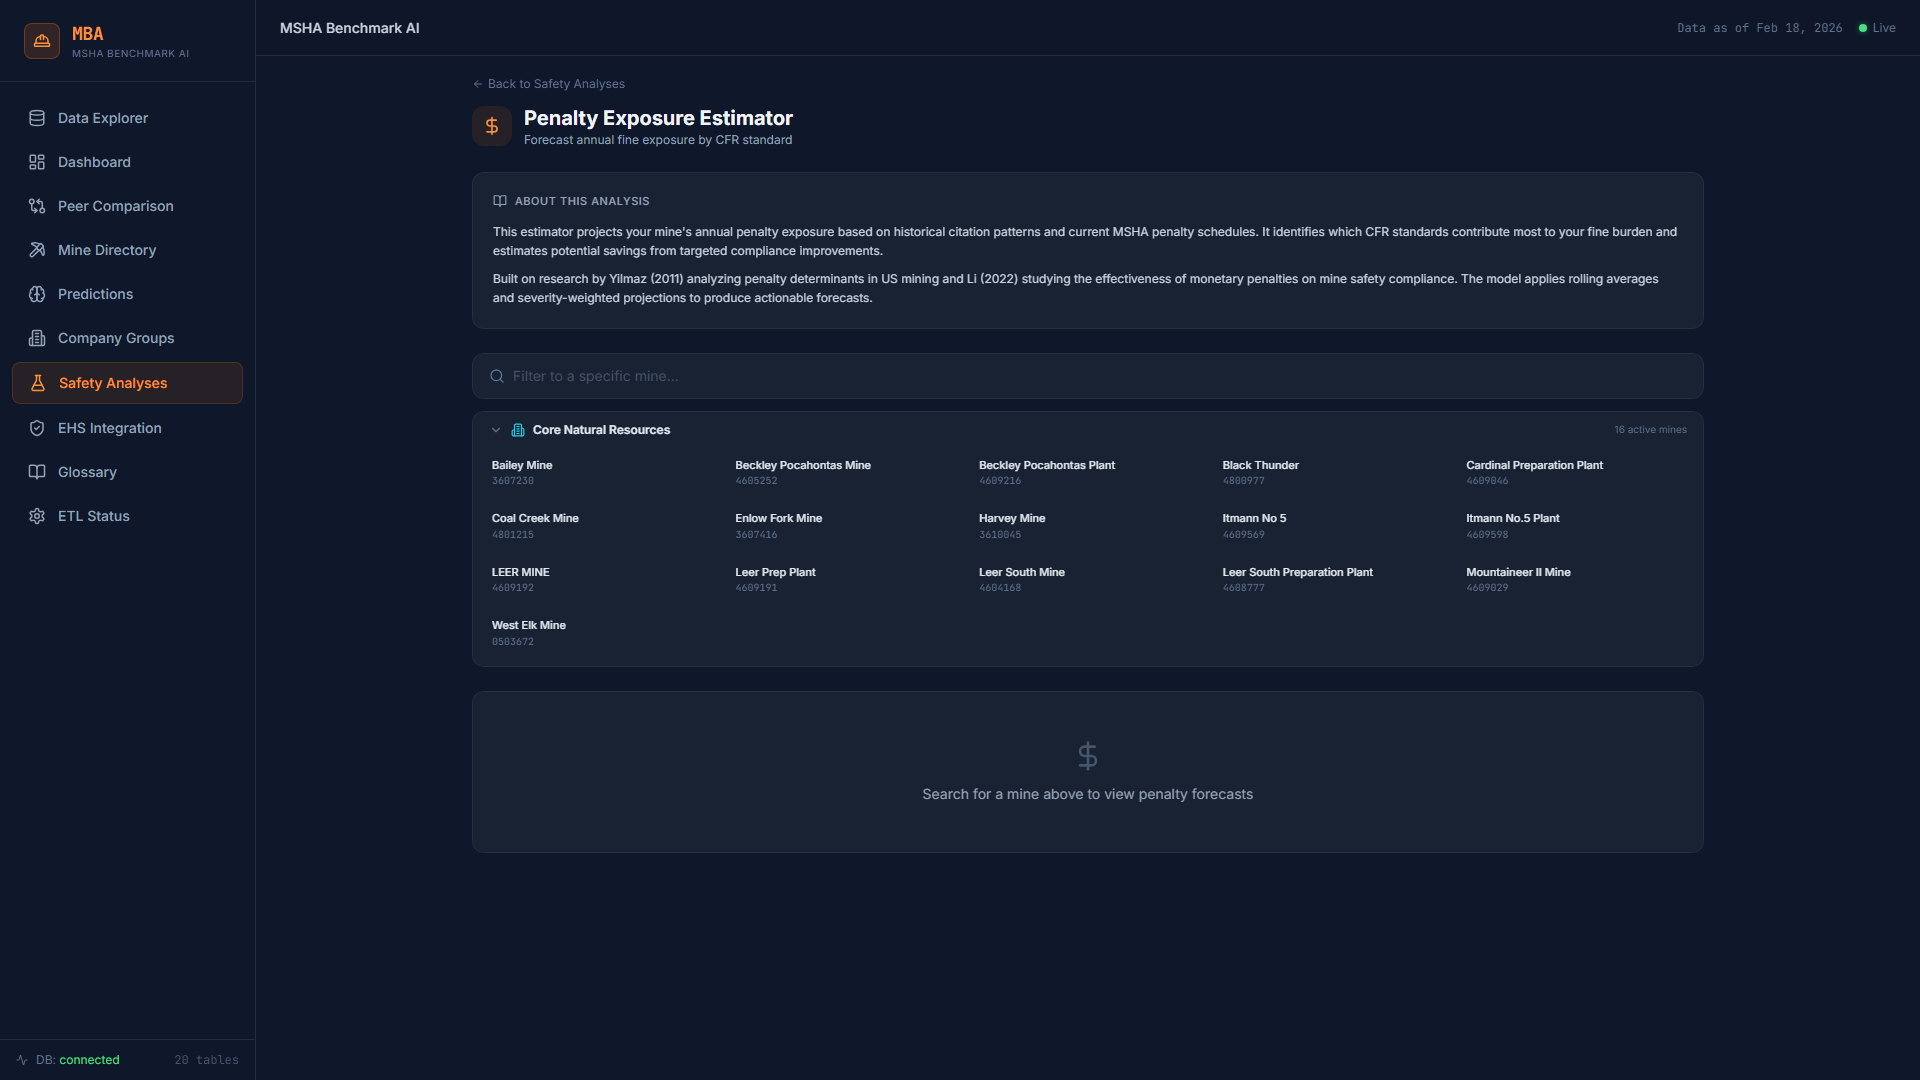
Penalty Exposure Estimator
Penalty Exposure Estimator — Based on Yilmaz (2011) and Li (2022)
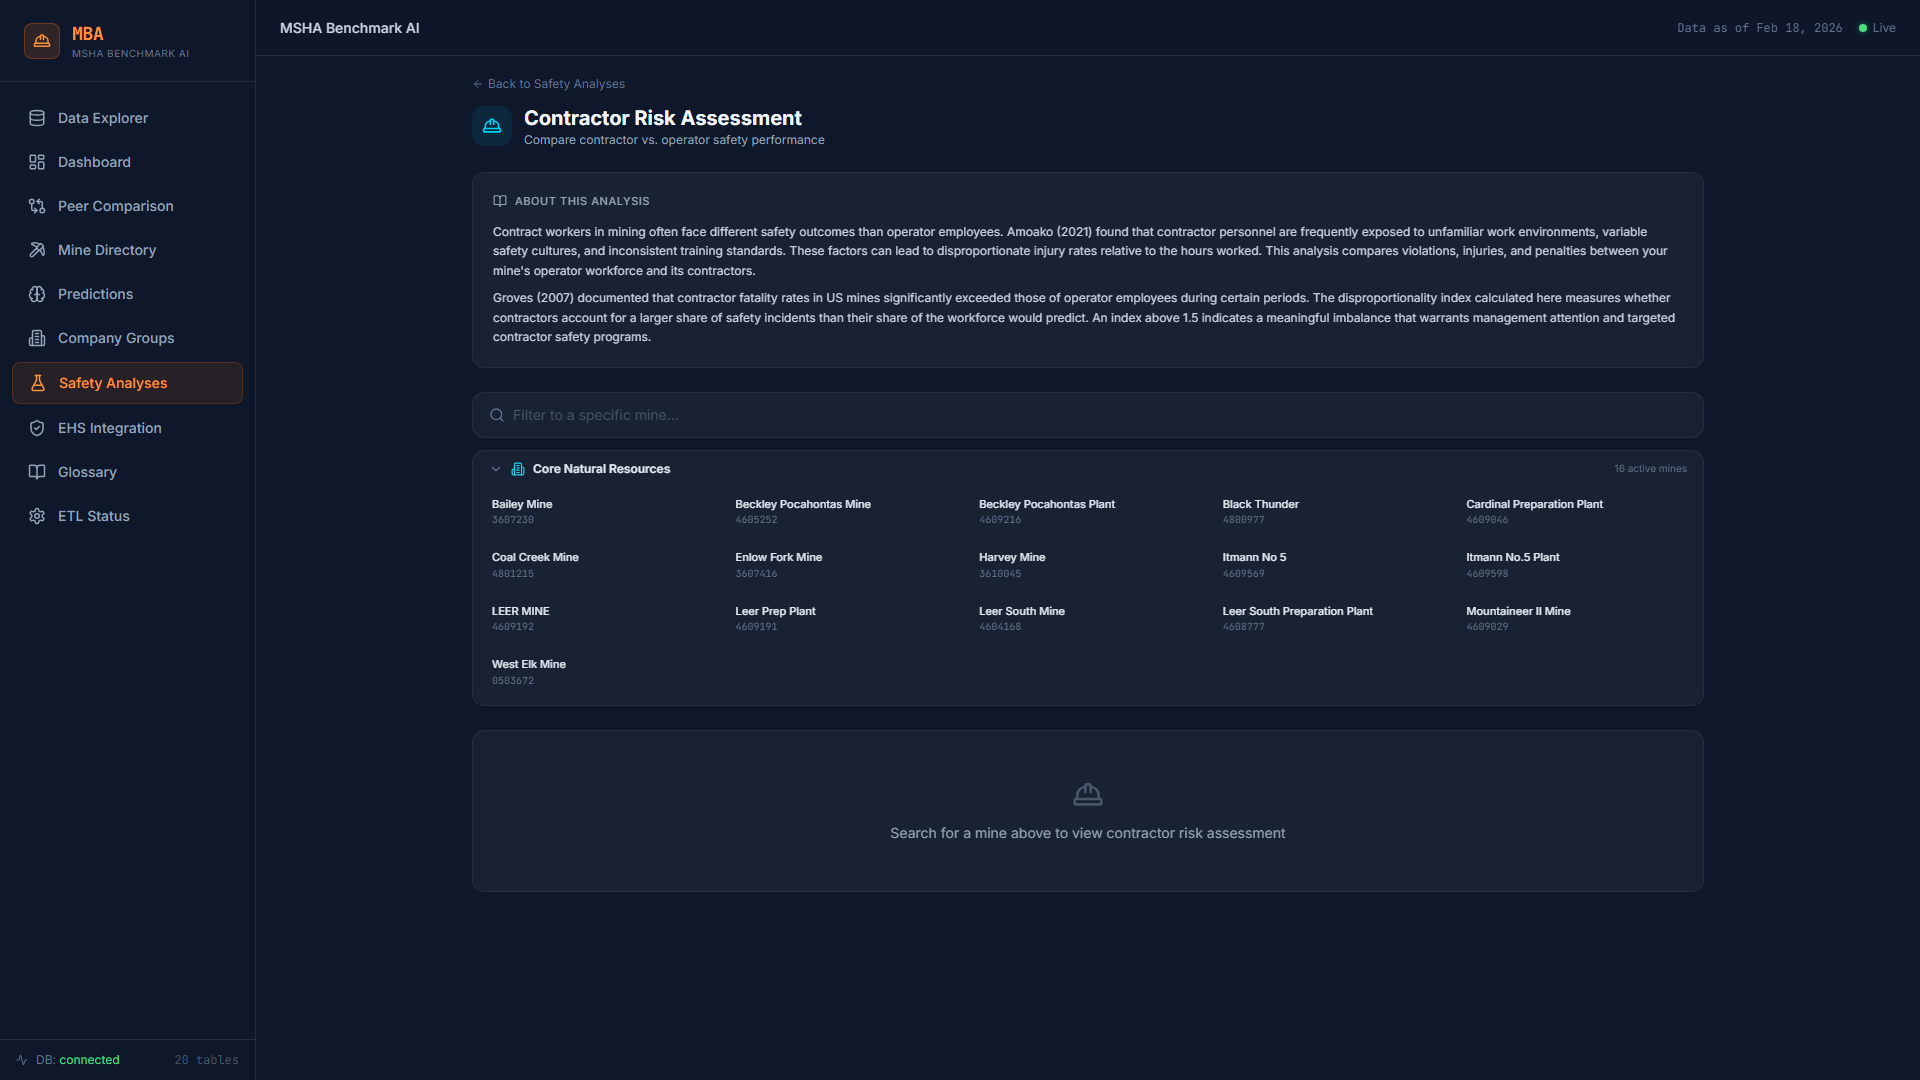
Contractor Risk Assessment
Contractor Risk Assessment — Based on Amoako (2021) and Groves (2007)
Request a Benchmarking Report

We can produce a sample peer benchmarking report for your operation using publicly available MSHA data — no internal data required to get started. See what the analysis looks like before committing to anything.

Request a Sample Report How We Work →